Visualization
Per-token Shapley and Banzhaf attributions are numeric tuples in
ExplainRunOutput. Renderer plugins turn those
values into review-ready figures for notebooks, reports, and stakeholder decks.
Renderers
Plugin key |
Output |
|---|---|
|
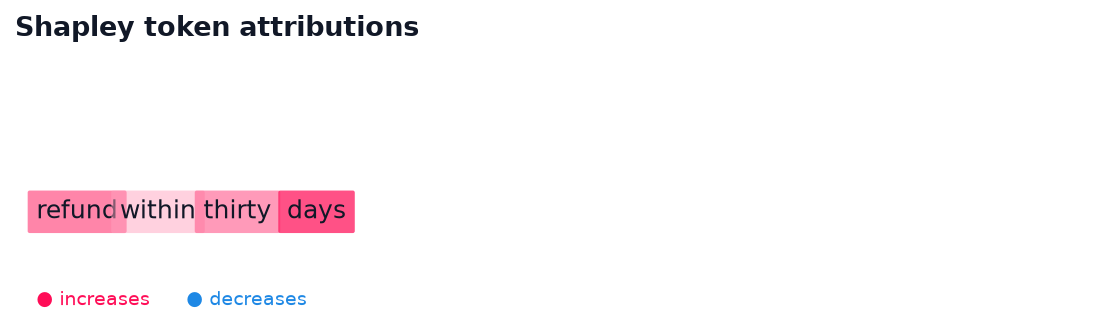
SHAP-style inline colored tokens (red / blue diverging highlights) |
|
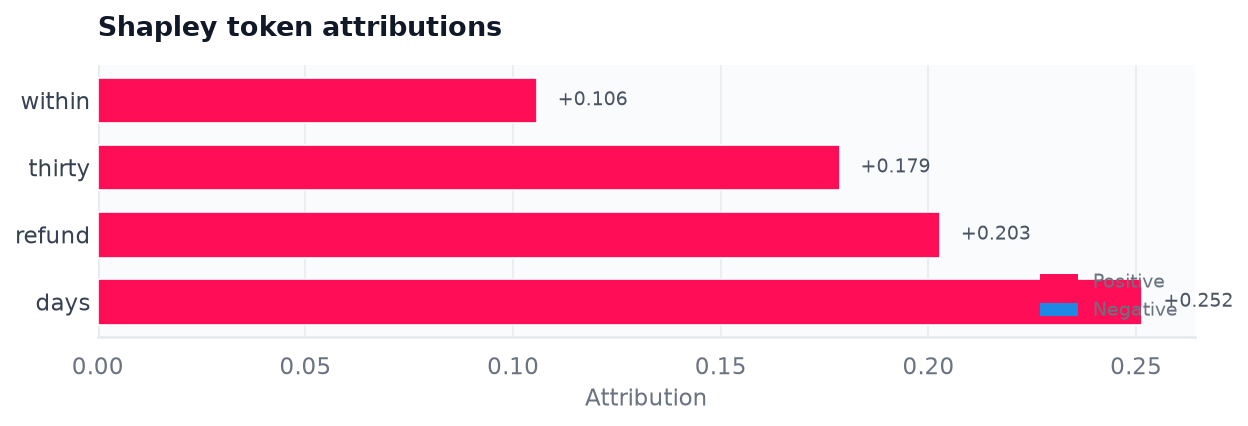
Horizontal bar chart with SHAP palette, value labels, and sign legend |
Install the optional visualization extra:
pip install "nlp-shap[viz]"
The renderers follow the SHAP palette: warm red for positive attributions and cool blue for negative attributions, with soft white-centered highlights for inline tokens. Figures use a Seaborn-backed clean theme (muted grid, no chart junk).
Quick start
from nlp_shap import ExplainRunner, ExplainConfig, render_attribution
from nlp_shap.domain.conversation import ConversationSnapshot, Message, Turn
from nlp_shap.domain.enums import Role
from nlp_shap.masking.partitions import TokenPartitioner

snapshot = ConversationSnapshot.from_turns((
    Turn(messages=(Message(role=Role.USER, text="refund within thirty days"),)),
))
config = ExplainConfig.model_validate({
    "backend": {"kind": "mock", "model_id": "stub"},
    "explanation": {
        "estimator": "exact",
        "estimand": "shapley",
        "value_fn": "tfidf_cosine",
        "absence_policy": "pad",
    },
})
output = ExplainRunner(config).explain_sync(snapshot)
player_set = TokenPartitioner().partition(snapshot)

figure = render_attribution(output, snapshot, player_set, renderer="token_bar")
figure.savefig("attribution.png", dpi=150, bbox_inches="tight")
Bar chart
Inline tokens
Jupyter HTML
For inline notebook display, use render_attribution_html() or
display_attribution_html() when IPython is available.
Color scale
Positive attributions use SHAP red (#FF0D57); negative attributions use SHAP
blue (#1E88E5). Inline token backgrounds fade from white toward the signed
color, matching the shap.plots.text emphasis pattern. Bar charts annotate
each token with its signed value.
Further reading
End-to-end explain notebook: Examples
Generative backends: Generative backends
API reference: Visualization