Visualization
Per-token Shapley and Banzhaf attributions are numeric tuples in
ExplainRunOutput. Renderer plugins turn those
values into review-ready figures for notebooks, reports, and stakeholder decks.
Renderers
Plugin key |
Output |
|---|---|
|
SHAP-style inline colored tokens (red / blue diverging highlights) |
|
Horizontal bar chart with SHAP palette, value labels, and sign legend |
Install the optional visualization extra:
pip install "mllm-shap[viz]"
The renderers follow the SHAP palette: warm red for positive attributions and cool blue for negative attributions, with soft white-centered highlights for inline tokens. Figures use a Seaborn-backed clean theme (muted grid, no chart junk).
Quick start
from mllm_shap import render_attribution

output = ExplainRunner(config).explain_sync(snapshot)
bar = render_attribution(output, snapshot, output.player_set, renderer="token_bar")
text = render_attribution(output, snapshot, output.player_set, renderer="token_text")
bar.savefig("attribution.png", dpi=150, bbox_inches="tight")
Pass the run’s output.player_set so labels match the players, title= to
label a figure and registry= to use a renderer registered in your own
PluginRegistry. The figures below come from
Attribution visualization, which explains three inputs with
Qwen/Qwen2.5-1.5B-Instruct and tfidf_cosine.
Words of a prompt
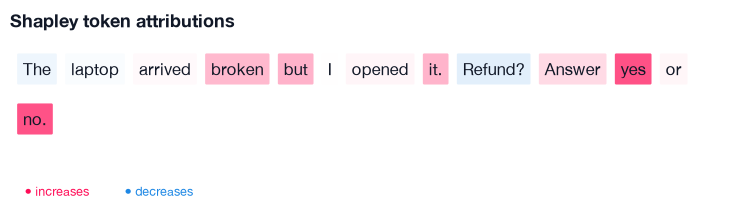
token_text: the words in reading order; “yes”, “no.”, “Refund?” and
“laptop” push the answer toward the original one, “opened it.” pulls against it.
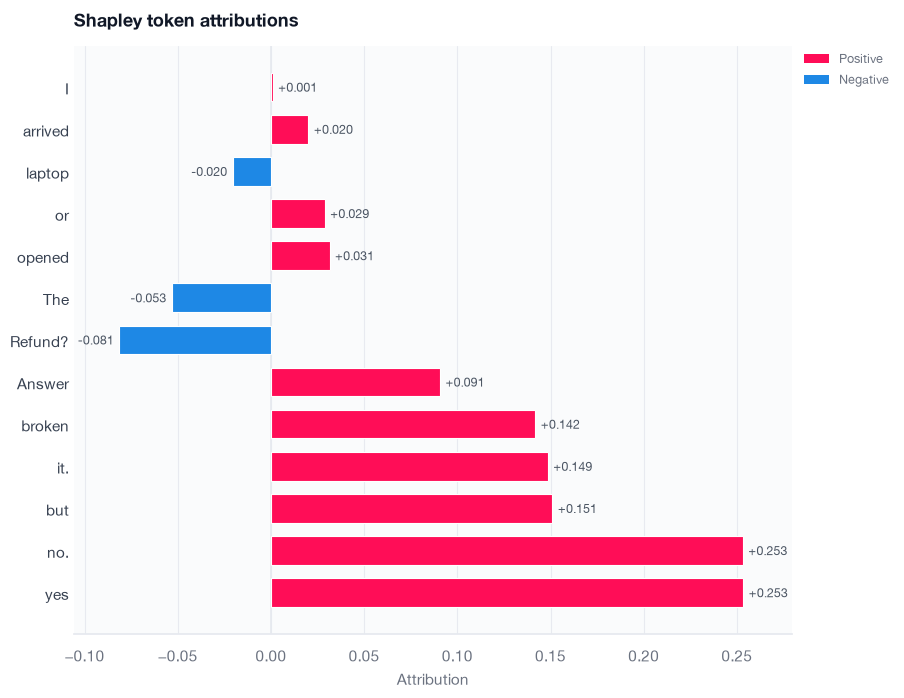
token_bar: the same values sorted by absolute size, each bar labelled
with its signed value.
Messages of a conversation
With players: messages each message is a player labelled with its role,
speaker and position; title= names the figure.
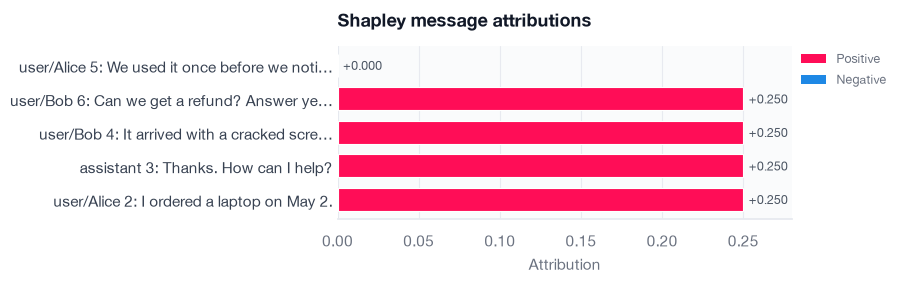
A five-message support thread: Alice’s order and Bob’s two messages carry the answer, the assistant’s greeting and Alice’s “used it once” matter less.
plot_conversation() keeps the thread’s shape: each message
under its role, speaker and position, with every player shaded where it stands
and text that is no player in grey. render_conversation_html()
returns the same view as HTML. It works for message and token players alike.
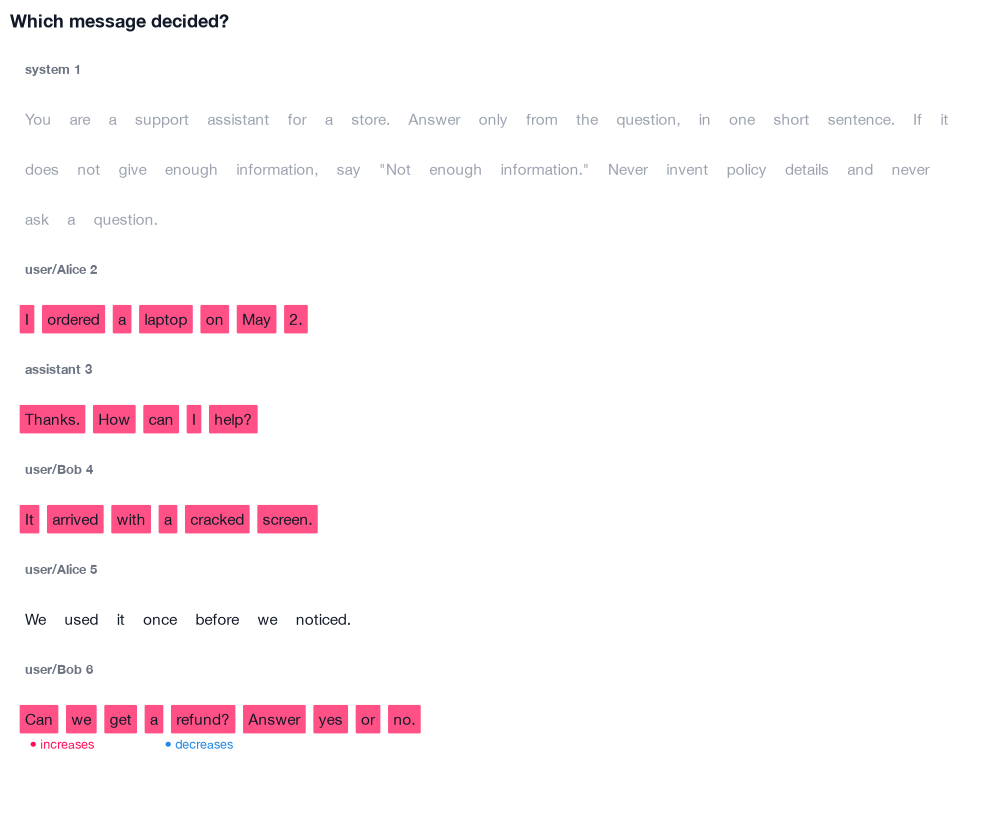
plot_conversation with players: messages.
With players: tokens and plugin_options: {tokens: {roles: [user]}} only the
users’ words are players; the other messages stay present and appear grey.
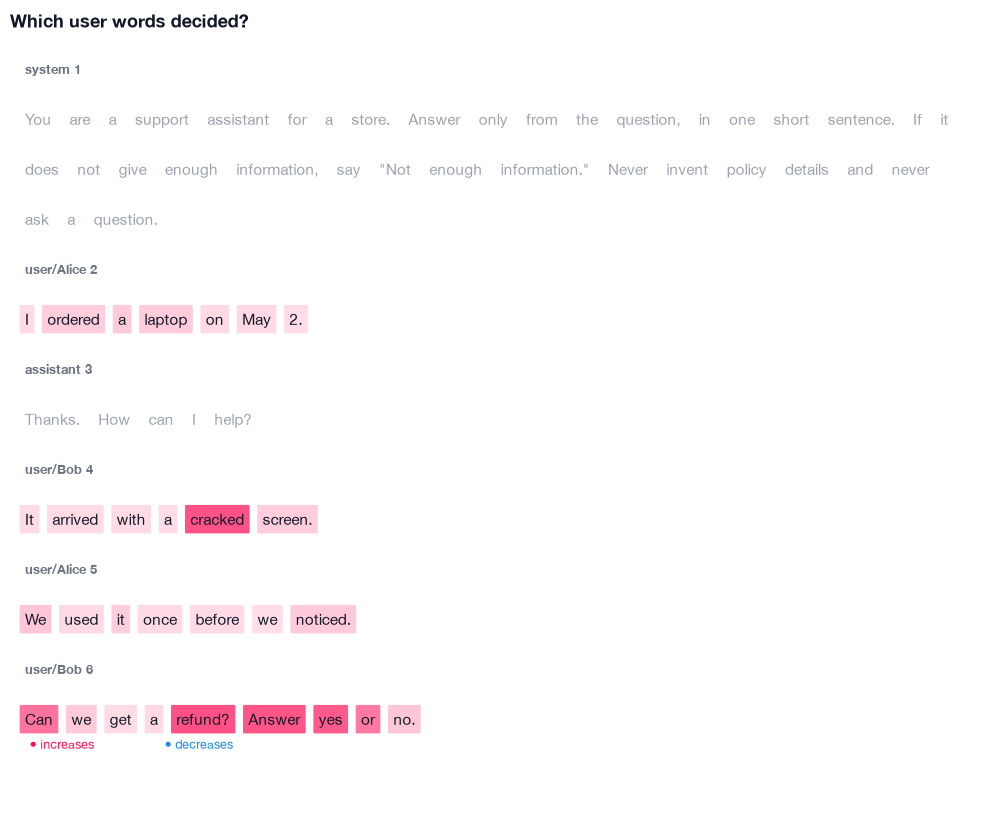
Per-word attributions of the users’ messages: “Can”, “Answer” and “yes” in Bob’s question decide; the assistant’s greeting is context, not a player.
Spoken words
For audio players (players: sgpa_segments, Audio alignment),
plot_audio_segments() colours each word’s stretch of audio by
its value over the waveform and its energy.
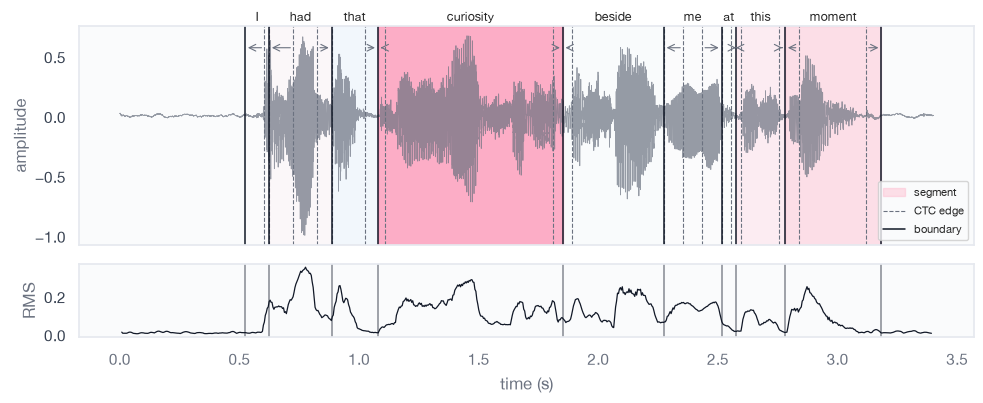
“curiosity” and “I” shape the model’s reading of the speaker’s mood most; “at” counts slightly against it.
With the sgpa_segments option text_roles: [user] the words of typed user
messages are players too, so typed and spoken words share one run and one colour
scale. plot_conversation() then adds a waveform strip below
each audio message, shaded on the same scale as the text.
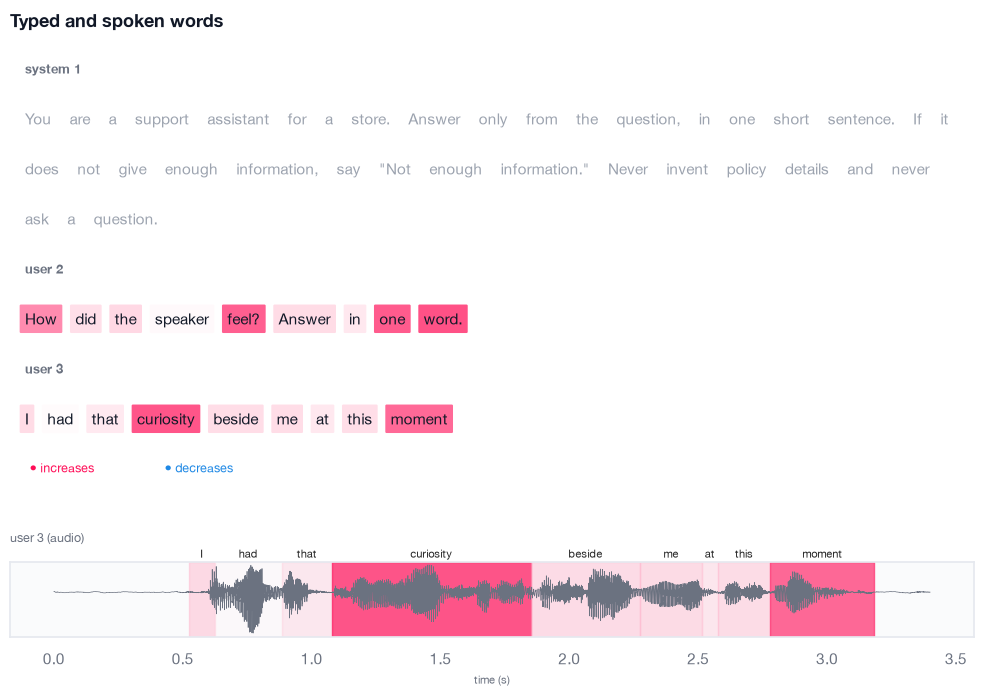
Typed and spoken words of one explanation.
Jupyter HTML
In a notebook, display_attribution_html() shows the colored
tokens inline without matplotlib, and render_attribution_html()
returns the same fragment as a string for reports:
from mllm_shap import display_attribution_html, render_attribution_html

display_attribution_html(output, snapshot, output.player_set)
html = render_attribution_html(output, snapshot, output.player_set, title="Refund")
Color scale
Positive attributions use SHAP red (#FF0D57); negative attributions use SHAP
blue (#1E88E5). Inline token backgrounds fade from white toward the signed
color, matching the shap.plots.text emphasis pattern. Bar charts annotate
each token with its signed value.
Further reading
examples/attribution_viz.ipynbandexamples/text_explain_e2e.ipynb(embedded on Examples)Generative backends: Generative backends
API reference: Visualization